· Petr Korab · Data Visualization
Bigram Word Cloud Animates Your Data Stories
Hands-on tutorial explaining how to create an Animated Word Cloud of bigram frequencies to display a text dataset in an MP4 video
Hands-on tutorial explaining how to create an Animated Word Cloud of bigram frequencies to display a text dataset in an MP4 video

Hands-on tutorial on modeling political statements with a state-of-the-art transformer-based topic model
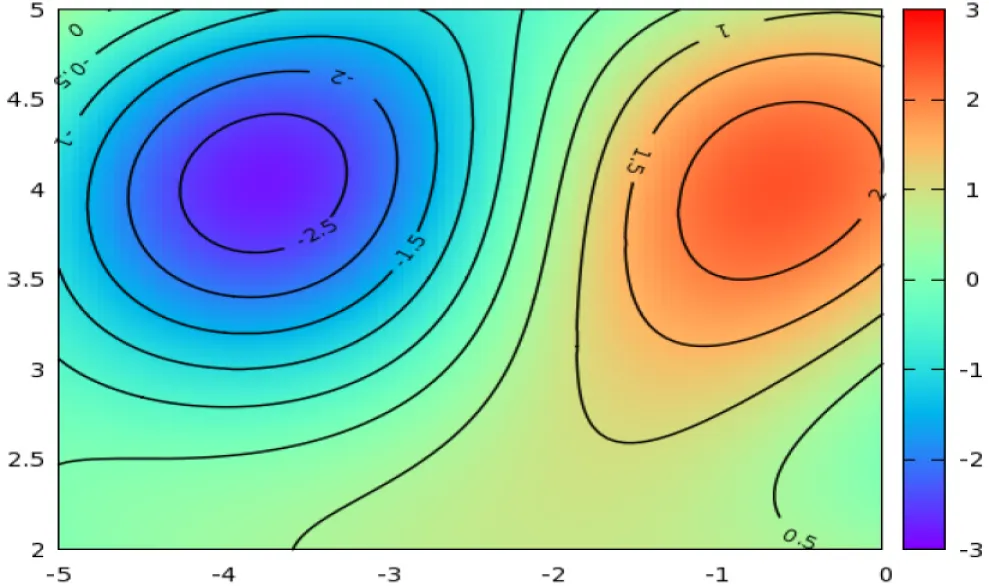
Contour plots are simple and very useful graphics for word embedding visualization. This end-to-end tutorial uses IMDb data to illustrate coding in Python.
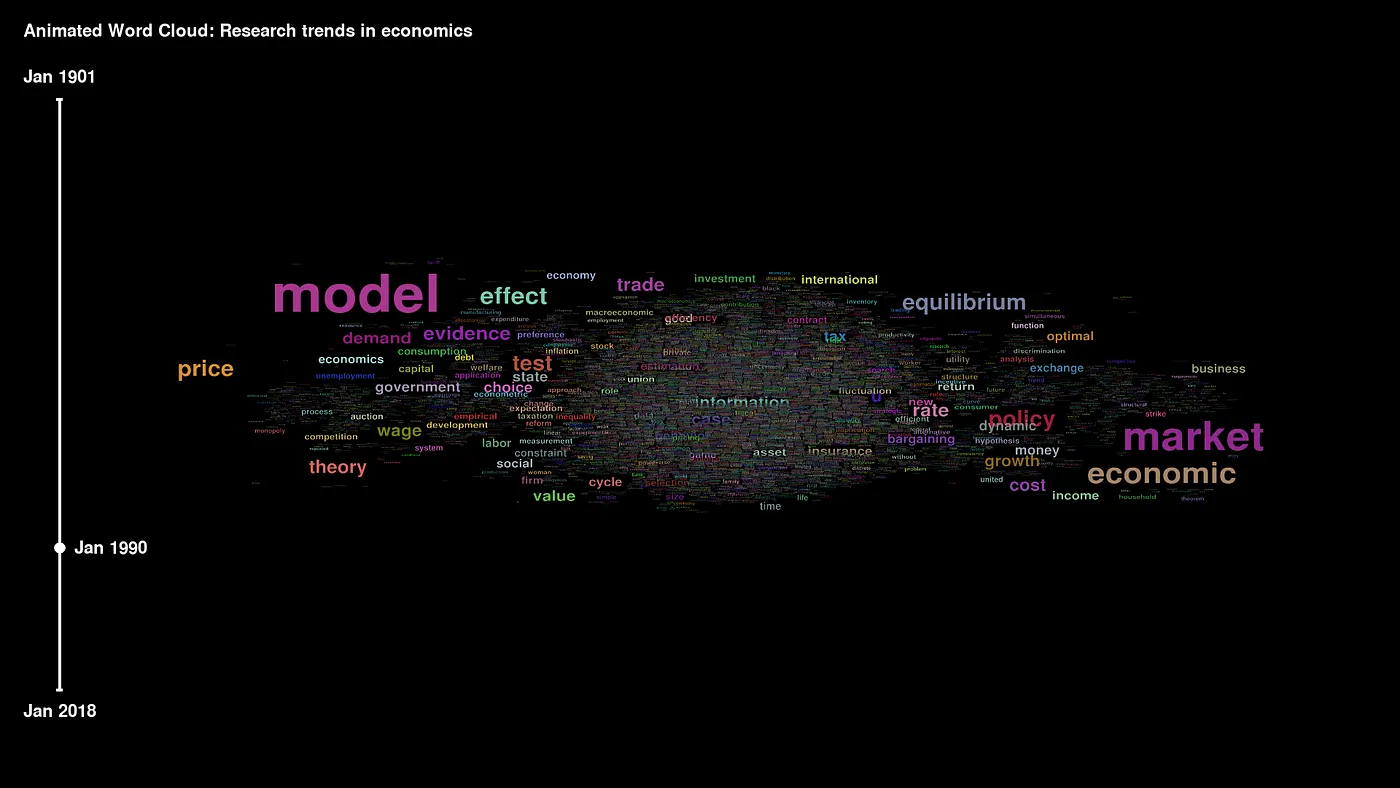
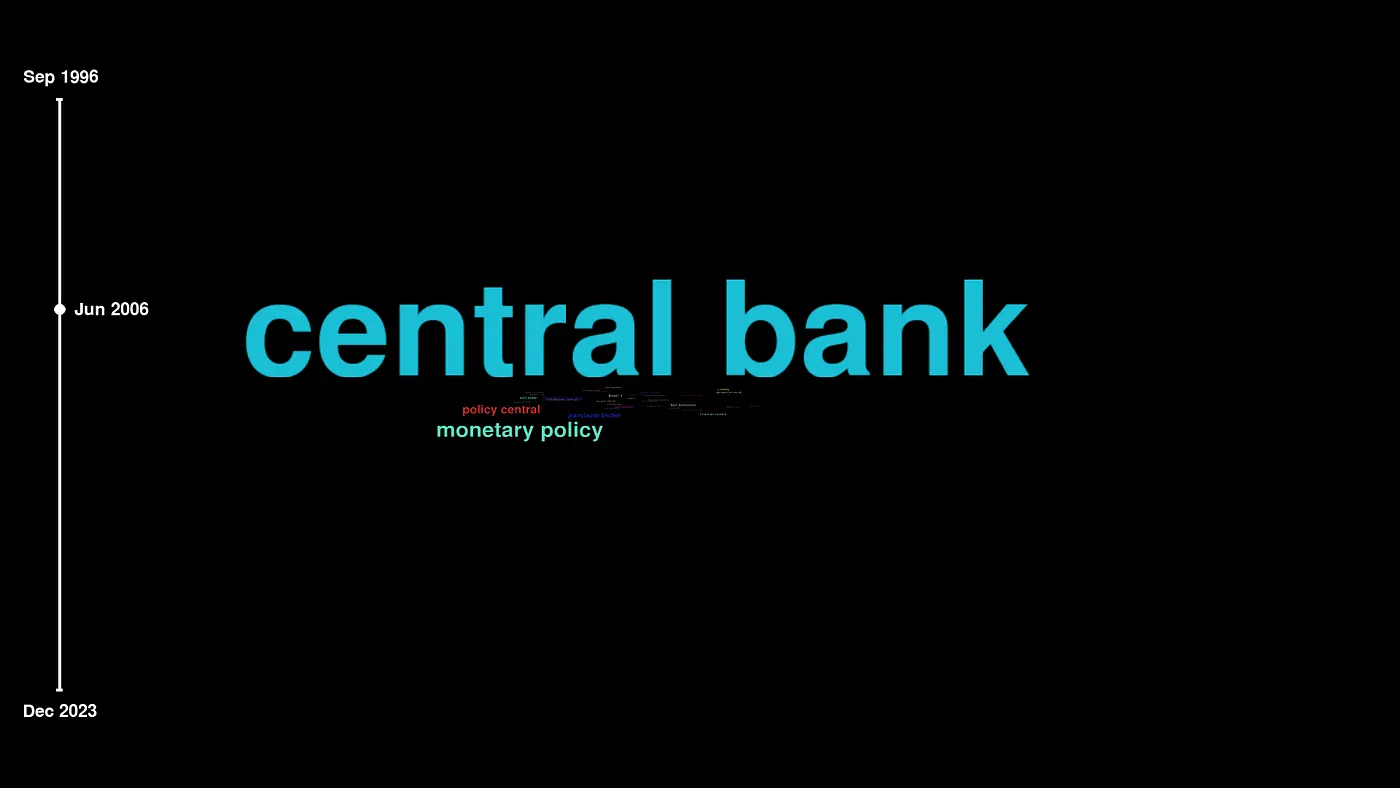
Animated word clouds turn classic word clouds into a dynamic visualization. Learn more about telling data stories in Python.
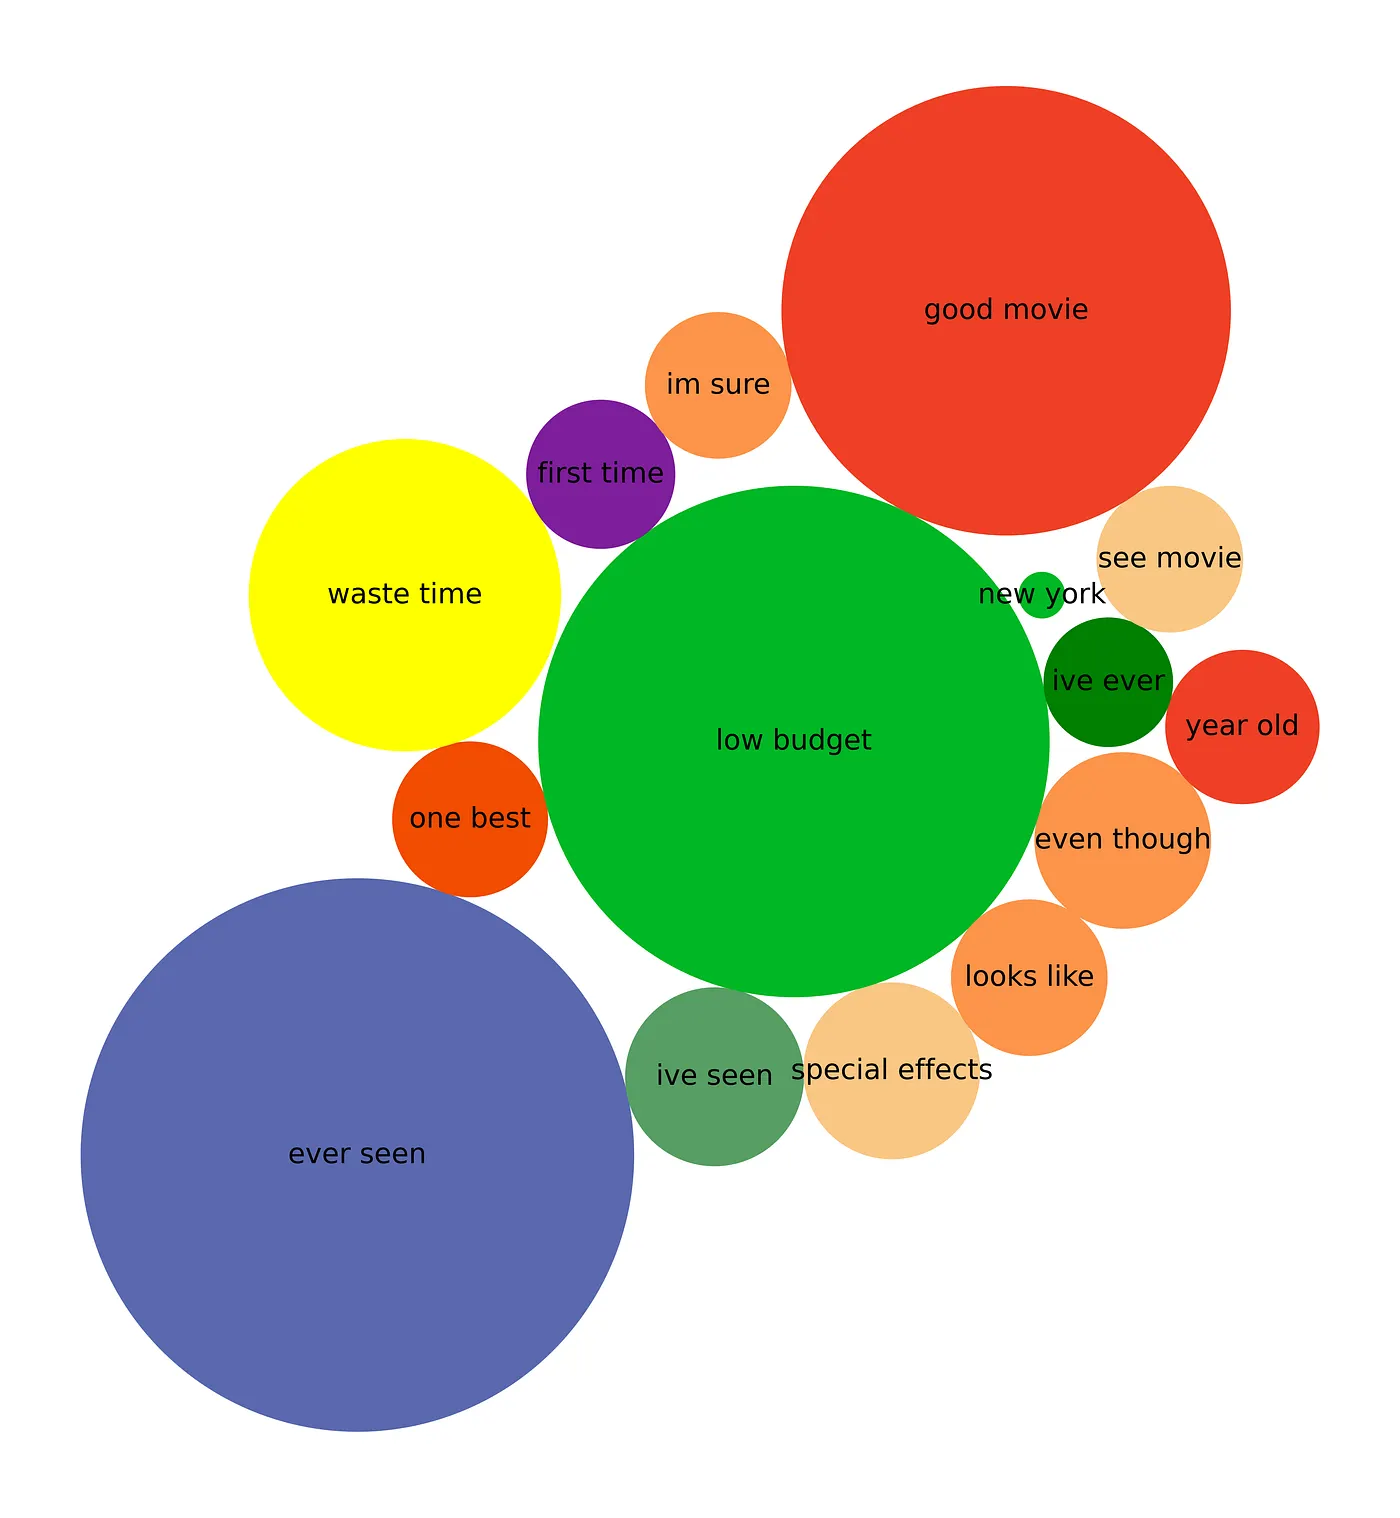
Explore n-gram word cloud, chord diagram, and a bubble chart, and their implementation in Python

Python tutorial on preparing animated word clouds that make a word frequency presentation stunning