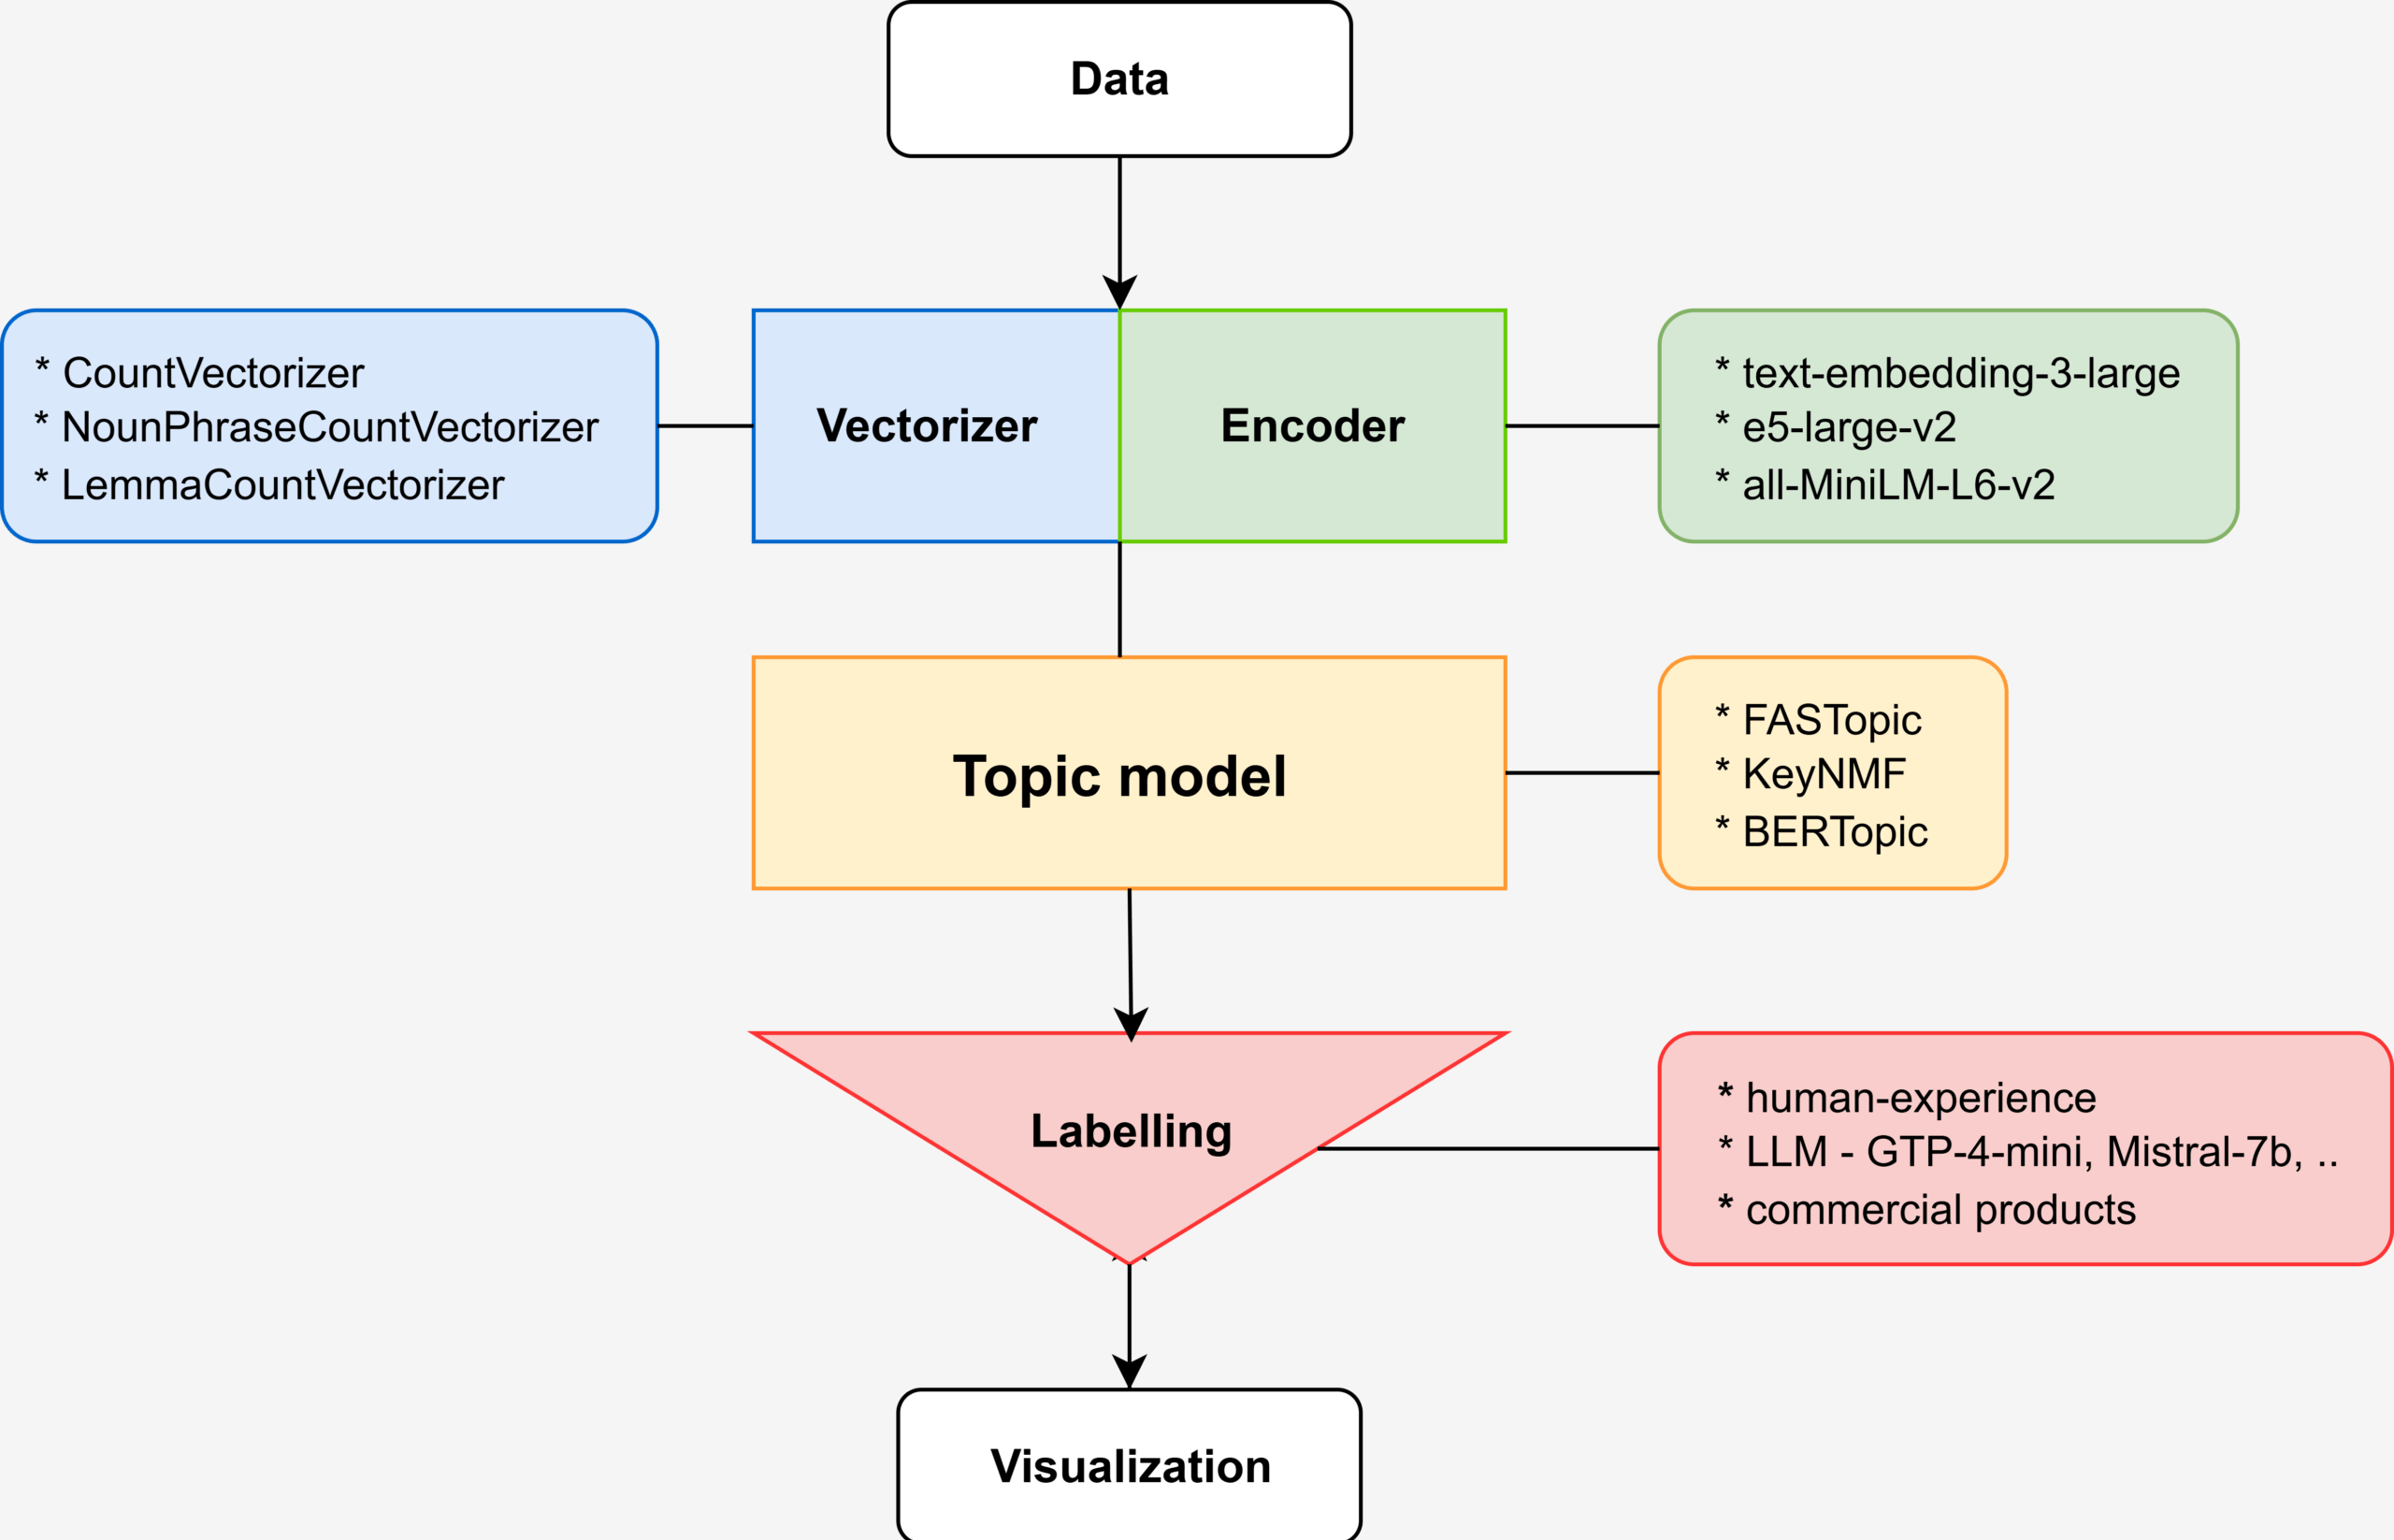
Python tutorial for reproducible labeling of topic models with GPT4-o-mini.
Comparison of two cutting-edge dynamic topic models in consumer complaints classification
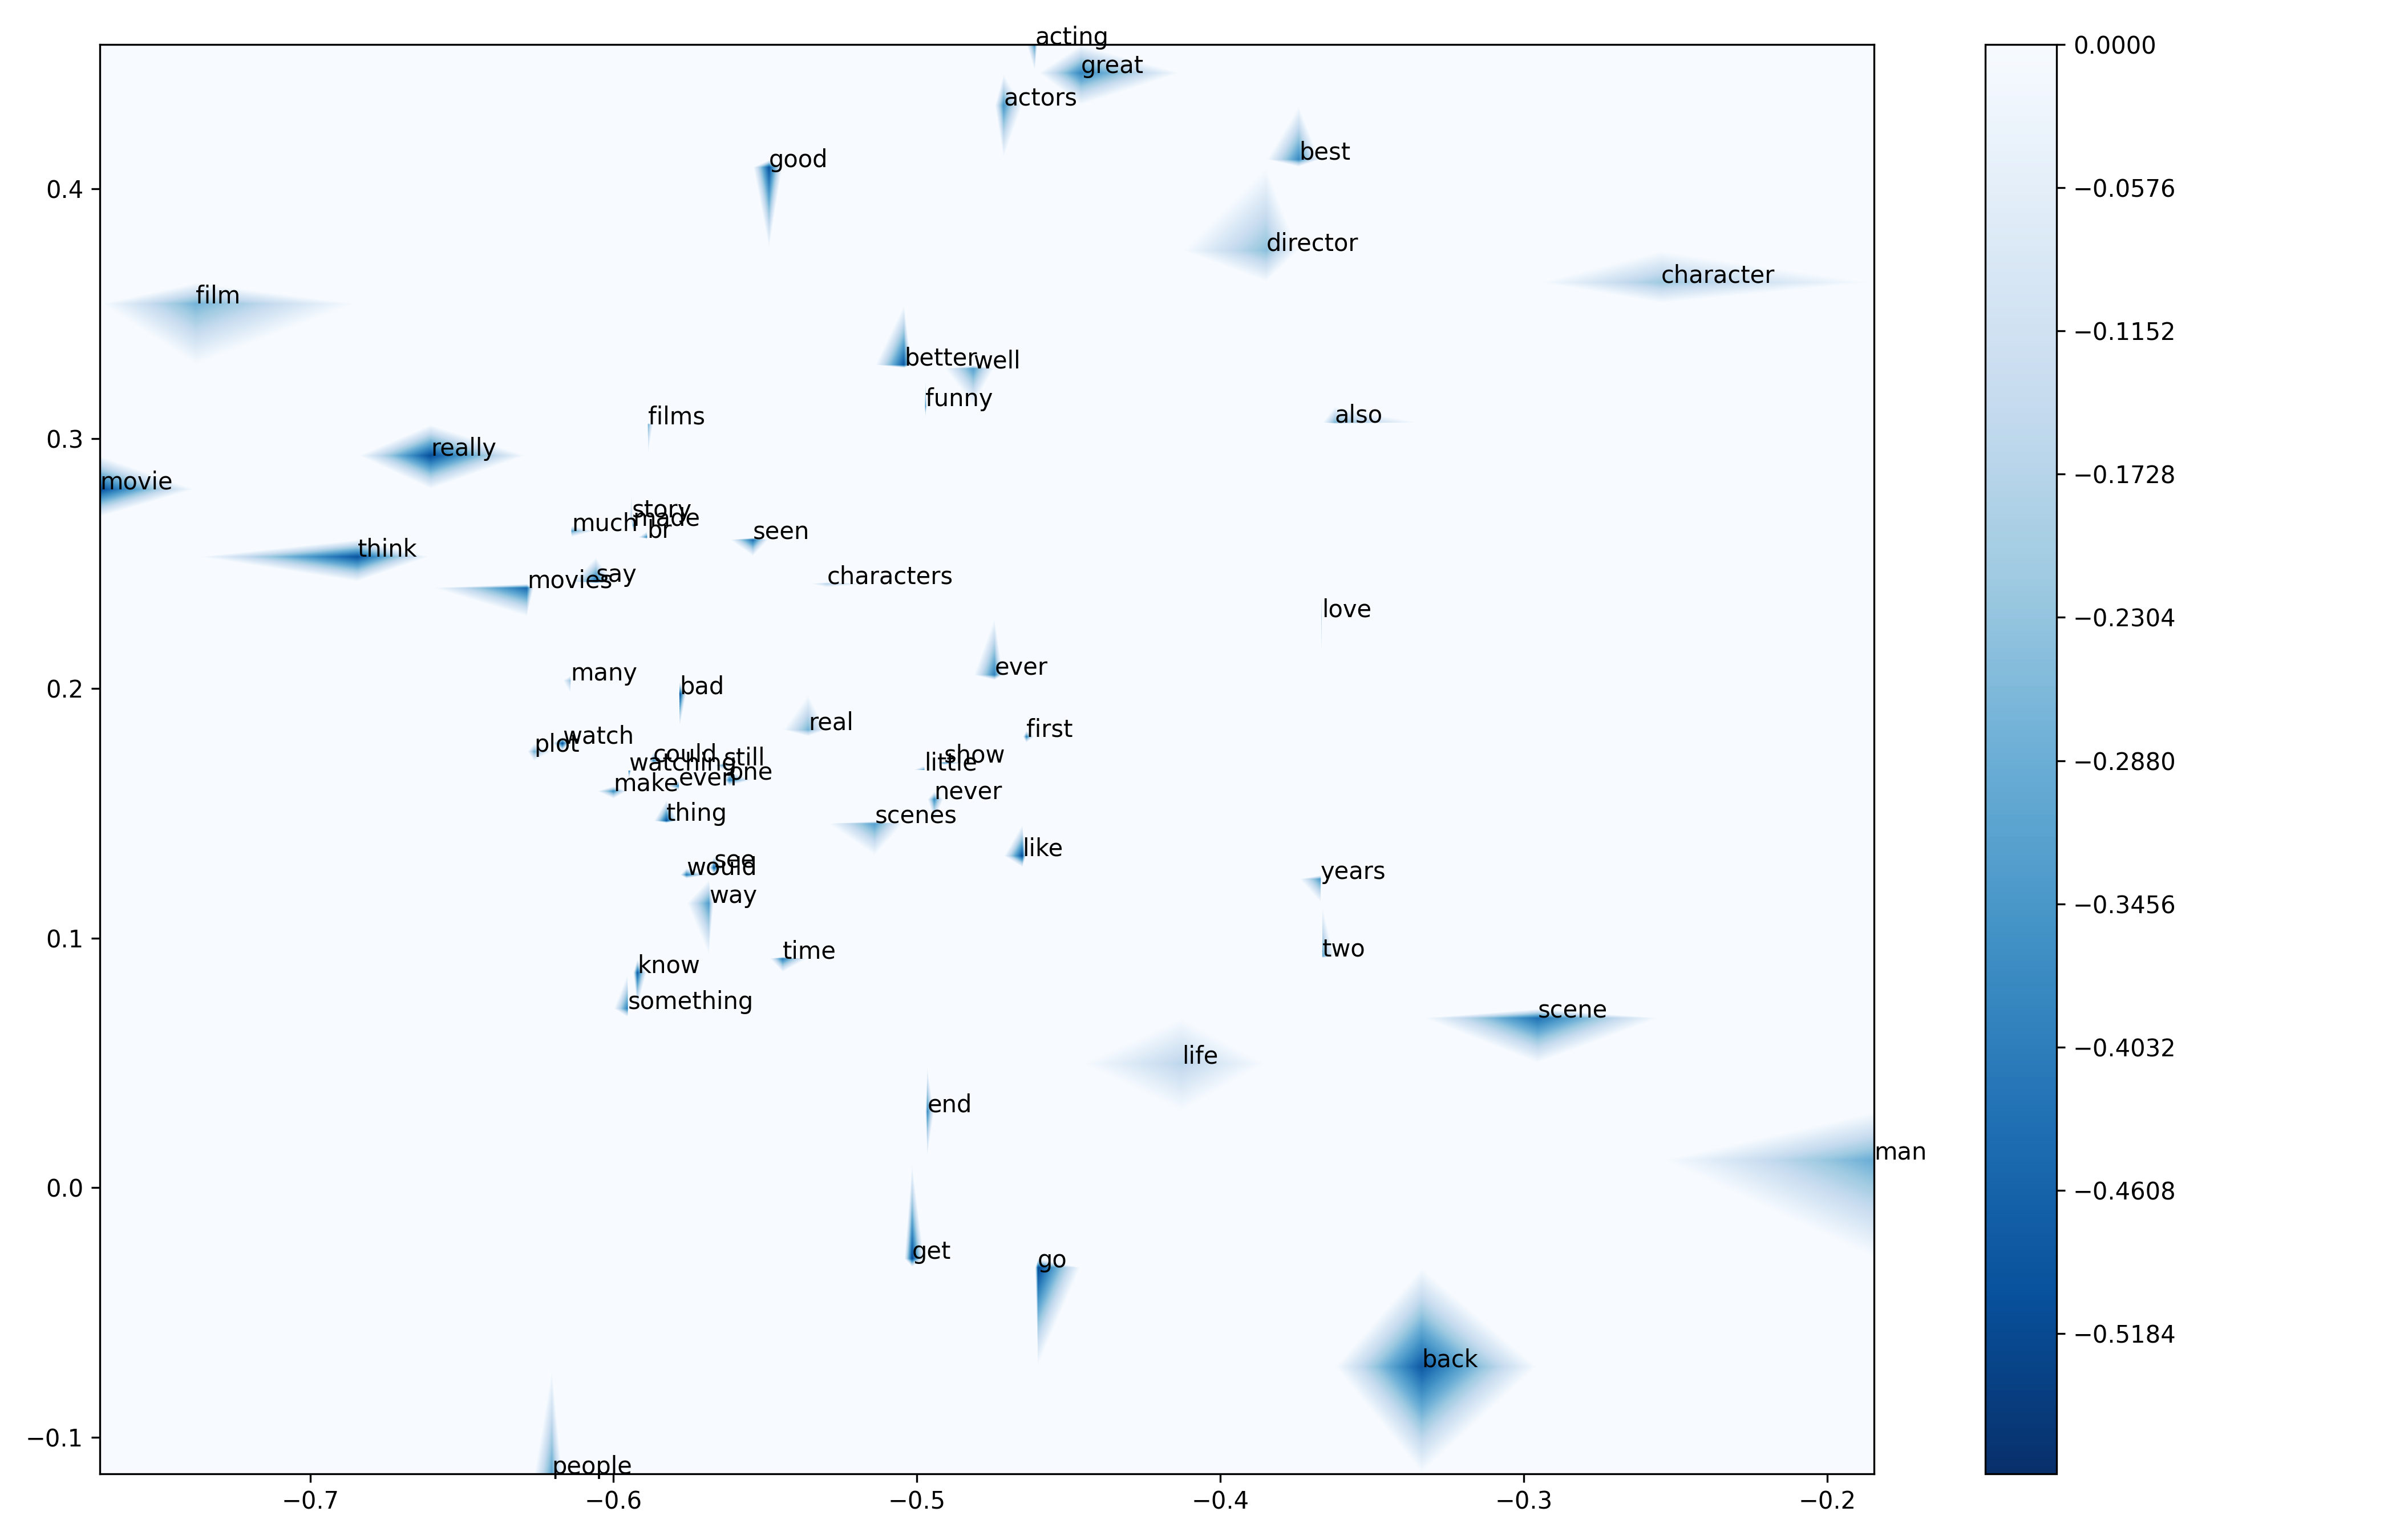
Contour plots are simple and very useful graphics for word embedding visualization.
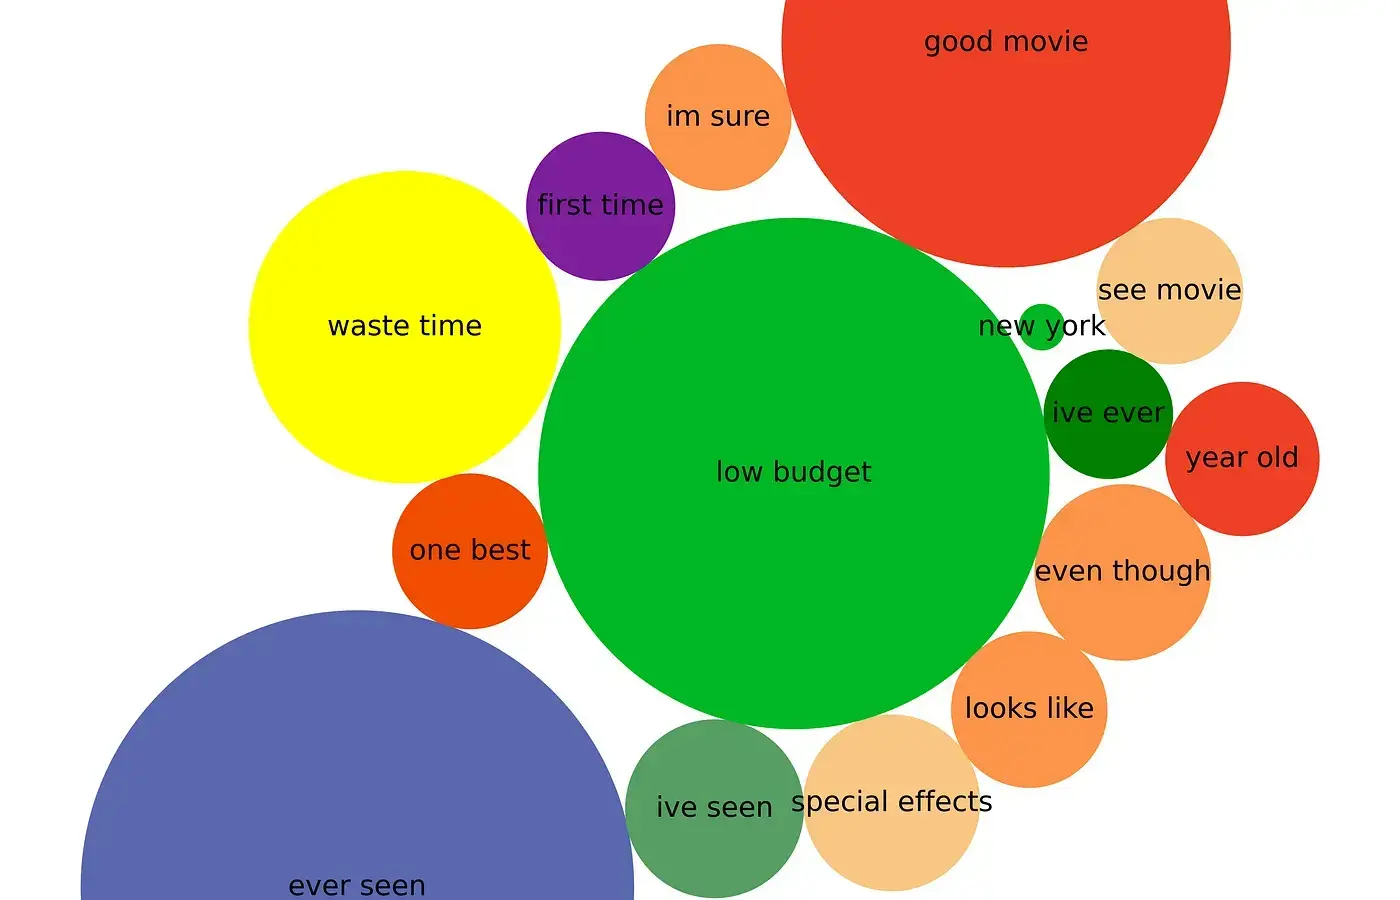
Explore n-gram word cloud, chord diagram, and a bubble chart, and their implementation in Python
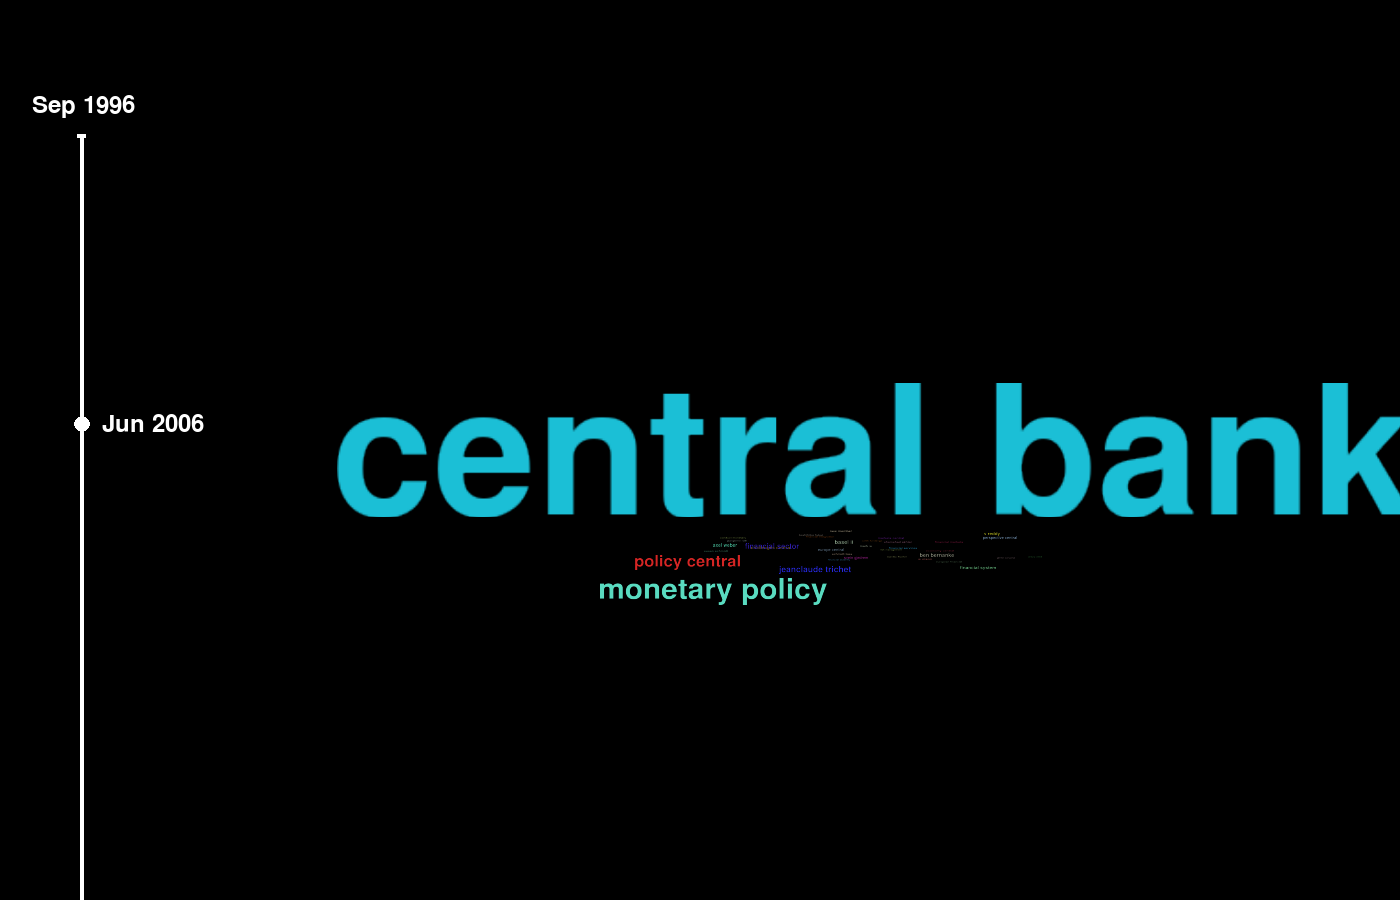
Bigram Animated Word Cloud displays a text dataset in an MP4 video

Arabica now offers a structural break and sentiment analysis module to enrich time-series text mining

Arabica now offers bigram and trigram word cloud, heatmap, and line chart

Arabica 1.0 improves time series text mining with an extended set of features

Discover how to visualize text networks in the circular, radial, and matrix plots

Concise, methodical guide, from use case definition to network estimation